My favorite git alias
When I use git I constantly need to understand the shape of the history graph.
And the best way to understand graphs is to visualize them.
Maybe you already know about git log --graph --oneline --decorate,
but that is a lot to type.
Add this alias to your .bash_profile, or .zshrc.
I call it glga for “git-log-graph-author”, you can call it what you want.
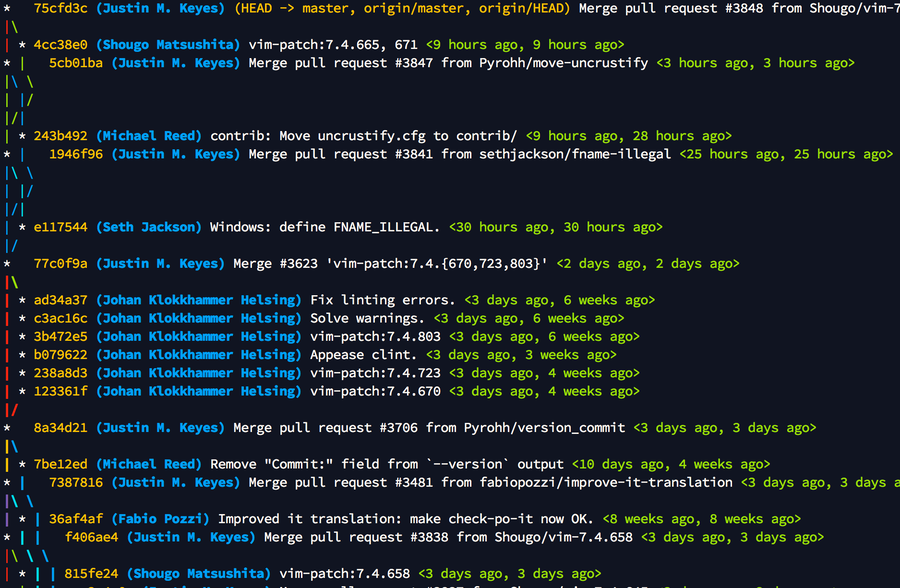
alias glga="git log --graph --abbrev-commit --date=short --pretty=format:\
  '%C(yellow)%h%Creset %C(bold blue)(%an)%Creset%C(yellow)%d%Creset %s %Cgreen<%cr, %ar>%Creset'"
Below is a sample screenshot of the output. At a glance you can see how the commits are related in the graph, their shas, their authors, messages, and commit/author dates relative to now.
The only alias I use more often is rbbe for bundle exec.